In this Case Study module we will discuss three key aspects of understanding a real-life Mergers & Acquisitions (M&A) deal:
- Company Overviews
- Merger Deal Overview
- Valuation Methods Used
We will take a deep look into the large M&A deal that took place in the eCommerce sector. In November 2009, Amazon, Inc. completed a previously announced acquisition of Zappos.com, Inc. Under the terms of the deal, Amazon paid Zappos.com’s shareholders approximately 10 million shares of Amazon stock (valued at $807 million at time the deal was announced) and $40 million in cash. The M&A deal was advised by investment banking teams at Morgan Stanley (Zappos) and Lazard (Amazon).
Company Overviews
Amazon.com is a customer-centric company for three kinds of customers: consumers, sellers and enterprises. The Company serves consumers through its retail websites, and focus on selection, price, and convenience. It also provides easy-to-use functionality, fulfillment and customer service. Amazon is the largest online retailer in the nation, with revenues exceeding $45 billion annually.
Zappos.com was the #1 online seller of shoes at the time of the deal, stressing customer service. It stocks 3 million pairs of shoes, handbags, apparel and accessories, specializing in some 1,000 brands that are difficult to find in mainstream shopping malls. Through its website (and 7,000 affiliate partners), Zappos.com distributes stylish and moderately priced footwear to frustrated and shop-worn customers nationwide. In 2008, one year prior to the deal, Zappos reported annual revenues exceeding $630 million.
Merger Deal Overview
The following graphic illustrates the timeline of Amazon’s acquisition of Zappos, from the birth of the possible transaction until the deal’s closing:
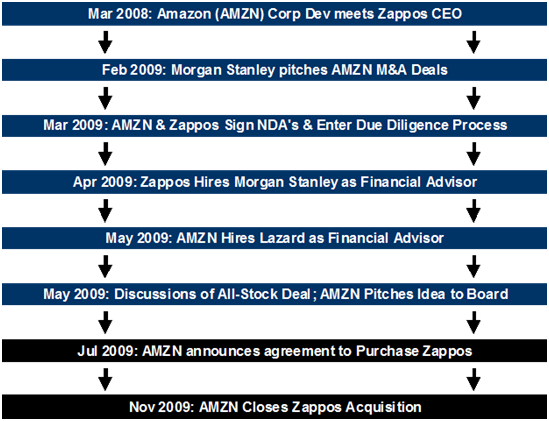
M&A Deal Announced: In July 2009, Amazon announced that it had reached an agreement to acquire Zappos in a deal that was valued at $847 million. The Purchase Price of the deal was financed with approximately 10 million shares of Amazon common stock and $40 million of Cash and Restricted Stock units on the balance sheet.
M&A Deal Closed: In November 2009, Amazon announced that it had closed the previously announced acquisition of Zappos. Given the closing price of Amazon stock on the previous Friday (October 30, 2009), the deal was valued at approximately $1.2 billion (including fees).
Financial Advisors
Two investment banks are enrolled in the merger process. In April 2009, Zappos formally engaged Morgan Stanley as its lead financial advisor to a possible sale or strategic relationship. Throughout April, Lazard met with Amazon and ultimately became the buy-side advisor for the transaction.
Rationale for the Deal
Shortly after the deal was announced, Amazon filed an S-4 registration document with the SEC detailing the rationale of both parties for undertaking the deal. Their reasoning was as follows:
- Amazon believed that there was a tremendous opportunity to grow the Zappos brand.
- Zappos was interested in keeping its brand and culture intact, and Amazon supported its vision as an independent company.
- Zappos felt it was in the best interest of shareholders to sell based on current valuations paid by Amazon.
Valuation Methods Used
Comparable Company Analysis
Morgan Stanley ran a Comparable Company Analysis as part of the valuation process when estimating the value of Zappos. Comparable Company Analysis is based on the idea that companies with similar characteristics should have approximately similar valuations. Morgan Stanley compared the financial information of Zappos to that of publicly traded Comparable Companies in the eCommerce space.
eCommerce companies used in Morgan Stanley’s Comparable Company Analysis included the following:
Selected Comparable Companies
- Amazon.com, Inc.
- Blue Nile Inc.
- Digital River Inc.
- GSI Commerce Inc.
- Netflix, Inc.
- OpenTable, Inc.
- Overstock.com Inc.
- VistaPrint Ltd.
For the analysis, Morgan Stanley looked at trading multiples in the eCommerce space for two key metrics of earnings: forward EBITDA (the ratio of Enterprise Value to next year’s expected Earnings Before Interest, Taxes, Depreciation & Amortization, or EBITDA) and forward Earnings (ratio of Equity Value to next year’s expected Net Income). Based on consensus estimates for calendar years 2009 and 2010, Morgan Stanley applied these ranges to the relevant Zappos financials.
Discounted Cash Flow Analysis
Morgan Stanley also calculated Equity Value ranges for Zappos based on Discounted Cash Flow (DCF) analysis. DCF models are often used in Investment Banking deals to value a company or asset using the time value of money concept. Expected future cash flows are discounted back to today to give the Net Present Value of those cash flows, which should approximate the current value of the underlying company or asset.
Components used in a DCF Analysis
- Company’s Free Cash Flow (Morgan Stanley projected out 10 years)
- Solving for Terminal Value of the Company (Morgan Stanley uses the Perpetuity Growth Rate approach)
- Weighted Average Cost of Capital (Discount Rate for the Company’s Equity and Debt, appropriately weighted for the Company’s relative mix of Debt and Equity)
Morgan Stanley calculated a Terminal Value as of July 1, 2019 by applying a Perpetual Growth Rate range of 3-4% and a Discount Rate range of 12.5-17.5%. The projected Free Cash Flows (unlevered), Discount Rates, and implied Terminal Value were then used to solve for the Net Present Value of Zappos’ expected future cash flows. Based on the DCF projections, Morgan Stanley implied a Zappos Equity Value range of $1,555-2,785 million. The lower end of the sensitivity analysis implied a Zappos Equity Value of $430 million, so the deal value was within the sensitivity range.
Precedent Transactions Analysis
As part of the due-diligence process, Morgan Stanley also performed a Precedent Transaction Analysis to imply a value for the company using recent historical M&A transactions of similar companies. Precedent Transaction Analysis is based on the idea that recently acquired companies with similar characteristics should provide a solid guideline for a reasonable Purchase Price for the given Target company (in this case, Zappos).
Morgan Stanley researched publicly available M&A transactions looking at deal multiples in the Internet sector with a buyout of $250 million or more since January 2008. The following is a list of the transactions that Morgan Stanley analyzed:
Selected Precedent Transactions (Target/Acquirer)
- Gmarket Inc./eBay Inc.
- Bill Me Later, Inc./eBay Inc.
- Greenfied Online Inc./Microsoft Corporation
- Bebo, Inc./Time Warner Inc.
- CNET Networks, Inc./CBS Corporation
- Audible, Inc./Amazon.com, Inc.
Using the transactions chosen, Morgan Stanley selected ranges of deal multiples and applied those ranges of multiples to the appropriate Zappos financials. Morgan Stanley applied a next-twelve-month (NTM) EBITDA range of approximately 15-30x to Zappos financials, which implied an Equity Value range of $530-1,120 million. Morgan Stanley applied a last-twelve-month (LTM) EBITDA range of approximately 25-75x, implying an Equity Value range of $270-885 million.
Historical Stock Price & Next Twelve Months (NTM) Multiple Analysis
Morgan Stanley also reviewed Amazon’s stock price performance relative to an eCommerce index, an Internet Bellwether Index, and the NASDAQ over various periods of time. The following companies comprised the eCommerce index:
eCommerce Index Components
- Blue Nile Inc.
- Digital River Inc.
- GSI Commerce Inc.
- Netflix, Inc.
- Overstock.com, Inc.
- VistaPrint Ltd.
The following companies comprised the Internet Bellwether index:
Internet Bellwether Index Components
- eBay Inc.
- Google Inc.
- Yahoo! Inc.
The table below shows Morgan Stanley’s analysis of stock price performance for these selected metrics:
| % Price Change | Amazon | eCommerce | Internet Bellwethers | NASDAQ |
| Last 30 Days | 12.50 | 10.50 | 15.10 | 8.50 |
| Last 90 Days | 12.40 | 7.90 | 18.10 | 16.40 |
| Last 180 Days | 78.20 | 115.00 | 62.20 | 30.80 |
| Last 12 Months | 30.00 | 23.00 | (21.30) | (15.90) |
| Last 2 Years | 24.30 | (10.00) | (42.00) | (28.70) |
| Last 3 Years | 168.20 | 41.70 | (22.70) | (5.20) |
Morgan Stanley then looked at recent trading multiples compared to next-twelve-months (NTM) Earnings Per Share and NTM EBITDA, as well as implied stock prices using these multiples, based on current NTM financials for Amazon. Morgan Stanley commented that over the period Amazon stock traded at an NTM Price/Earnings multiple range of 21.9-94.4x and an NTM EBITDA range of 8.2-32.5x.
Footnote: Selected Zappos.com, Inc. Financial Results
| Zappos.com, Inc. |
2007 |
2008 |
2009 |
|||
| Income Statement, in $ thousands |
3 months ended June 30 |
12 months ended Dec 31 |
6 months ended June |
12 months ended Dec 31 |
3 months ended June 30 |
6 months ended June 30 |
| Net revenues | 152,613 | 526,829 | 285,323 | 635,011 | 165,236 | 309,099 |
| Cost of revenues | 97,158 | 333,884 | 181,406 | 411,650 | 106,555 | 201,092 |
| Gross Profit | 55,455 | 192,945 | 103,917 | 223,361 | 58,681 | 108,007 |
| Operating expenses: | ||||||
| Sales, marketing and fulfillment | 37,862 | 123,260 | 70,792 | 153,285 | 36,870 | 71,688 |
| General and Administrative | 5,870 | 18,962 | 11,997 | 23,041 | 5,788 | 10,989 |
| Product Development | 6,154 | 18,224 | 12,443 | 25,262 | 5,767 | 11,514 |
| Total operating expense | 49,886 | 160,446 | 95,232 | 201,588 | 48,425 | 94,191 |
| Income from operations | 5,569 | 32,499 | 8,685 | 21,773 | 10,256 | 13,816 |
| Interest and other income, net | 133 | 731 | 325 | 559 | 101 | 173 |
| Interest benefit (expense) associated with preferred stock warrant | (5,771) | (10,825) | (5,746) | 9,670 | (12,441) | (13,721) |
| Other interest expense | (1,067) | (6,930) | (2,814) | (5,825) | (826) | (1,775) |
| Other financing charges | (121) | (335) | (280) | (832) | (102) | (226) |
| Income (loss) before provision for income taxes | (1,257) | 15,140 | 170 | 25,345 | (3,012) | (1,733) |
| Provision for income taxes | (1,562) | (10,288) | (1,550) | (5,208) | (3,343) | (4,356) |
| Net income (loss) from continuing operations | (2,819) | 4,852 | (1,380) | 20,137 | (6,355) | (6,089) |
| Discontinued operations, net of tax | (679) | (3,084) | (1,525) | (9,365) | 30 | (14) |
| Net income (loss) | (3,498) | 1,768 | (2,905) | 10,772 | (6,325) | (6,103) |
←Mergers & Acquisitions (M&A) Valuation