An illustrative example of a paper LBO is provided below in 5 simple steps. In a paper LBO exercise, you will be expected to complete the important components of a working LBO model with the use of paper and pencil and without the use of a computer.
Given LBO Parameters and Assumptions
- XYZ Private Equity Partners purchases ABC Target Company for 5.0x Forward 12 months (FTM) EBITDA at the end of Year 0.
- The debt-to-equity ratio for the LBO acquisition will be 60:40.
- Assume the weighted average interest rate on debt to be 10%.
- ABC expects to reach $100 million in sales revenue with an EBITDA margin of 40% in Year 1.
- Revenue is expected to increase by 10% year-over-year (y-o-y).
- EBITDA margins are expected to remain flat during the term of the investment.
- Capital expenditures are expected to equal 15% of sales each year.
- Operating working capital is expected to increase by $5 million each year.
- Depreciation is expected to equal $20 million each year.
- Assume a constant tax rate of 40%.
- XYZ exits the target investment after Year 5 at the same EBITDA multiple used at entry (5.0x FTM EBITDA).
- Assume all debt pay-down occurs at the moment of sale at the end of Year 5 (this eliminates the iterative/circular dependency between debt pay-down/cash balances and interest expense in a computer-based LBO model).
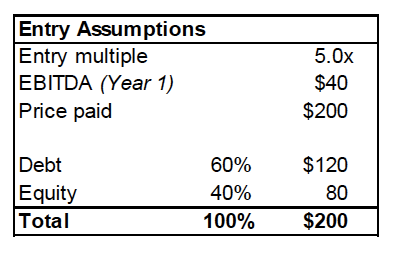
1. Calculate the purchase price of ABC.
Using a 5.0x entry multiple, calculate the price paid by multiplying by Year 1 EBITDA. $40 million in EBITDA (which represents a 40% EBITDA margin on $100 million in revenue) multiplied by 5. The purchase price is $200 million.
2. Calculate the debt and equity funding amounts used for the purchase price.
The given information assumes debt to equity ratio of 60:40 for the purchase price.
Debt portion = 60% × $200 million, or $120 million.
Equity portion = 40% × $200 million, or $80 million.
3. Build the Income Statement.
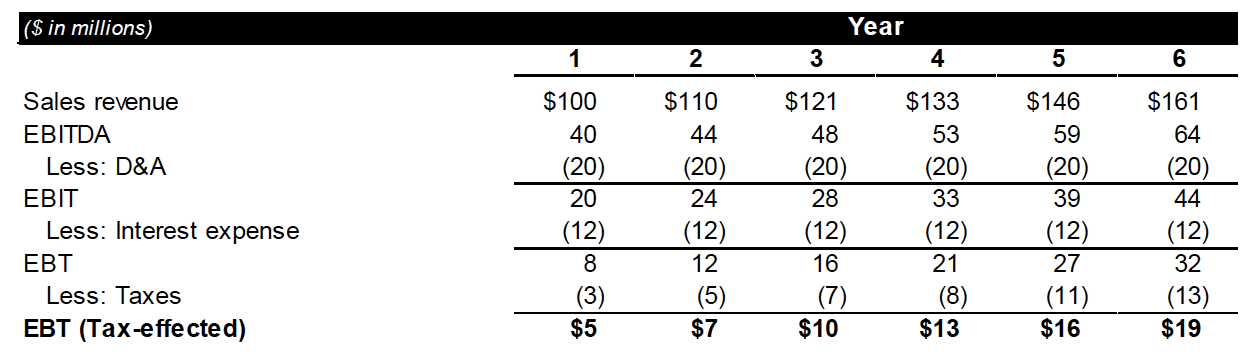
(Notice that, because the exit value at the end of Year 5 will be based on a forward EBITDA multiple, we must calculate six year’s worth of income statement, not 5. Also note that the numbers might not agree perfectly because of rounding. It is reasonable to round your intermediate calculations to the nearest integer in carrying over calculations to the next step.)
- Project revenue: Revenue is expected to grow 10% annually.
$100 million Year 1 sales × (1 + 10% growth rate) = $110 million sales in Year 2.
$110 million Year 2 sales × (1 + 10% growth rate) = $121 million sales in Year 3.
$121 million Year 3 sales × (1 + 10% growth rate) = $133.1 million sales in Year 4.
$133 million Year 4 sales × (1 + 10% growth rate) = $146.3 million sales in Year 5.
$146 million Year 5 sales × (1 + 10% growth rate) = $160.6 million sales in Year 6. - Use EBITDA margin to calculate EBITDA.
$100 million Year 1 sales × 40% EBITDA margin = $40 million Year 1 EBITDA.
$110 million Year 2 sales × 40% EBITDA margin = $44 million Year 2 EBITDA.
$121 million Year 3 sales × 40% EBITDA margin = $48 million Year 3 EBITDA.
$133 million Year 4 sales × 40% EBITDA margin = $53 million Year 4 EBITDA.
$146 million Year 5 sales × 40% EBITDA margin = $59 million Year 5 EBITDA.
$161 million Year 6 sales × 40% EBITDA margin = $64 million Year 6 EBITDA. - Subtract Depreciation & Amortization (D&A) to get EBIT.
$40 million Year 1 EBITDA – $20 million D&A = $20 million Year 1 EBIT. (etc. for Years 2-6) - Calculate interest expense using the debt amount used for purchase multiplied by the interest rate to calculate the yearly interest expense line item.
$120 million of debt × 10% interest rate = $12 million interest expense per year. - Calculate Earnings Before Tax (EBT).
$20 million Year 1 EBIT – $12 million int. exp. = $8 million Year 1 EBT. (etc. for Years 2-6) - Subtract taxes using the tax rate to get to tax-effected EBT (a proxy for Net Income).
$8 million Year 1 EBT × 40% tax rate = $3 million taxes, so $5 million Year 1 t/e EBT.
$12 million Year 2 EBT × 40% tax rate = $5 million taxes, so $7 million Year 2 t/e EBT.
$16 million Year 3 EBT × 40% tax rate = $6 million taxes, so $10 million Year 3 t/e EBT.
$21 million Year 4 EBT × 40% tax rate = $8 million taxes, so $13 million Year 4 t/e EBT.
$27 million Year 5 EBT × 40% tax rate = $11 million taxes, so $16 million Year 5 t/e EBT.
$32 million Year 6 EBT × 40% tax rate = $13 million taxes, so $19 million Year 6 t/e EBT.
4. Calculate cumulative levered free cash flow (FCF).
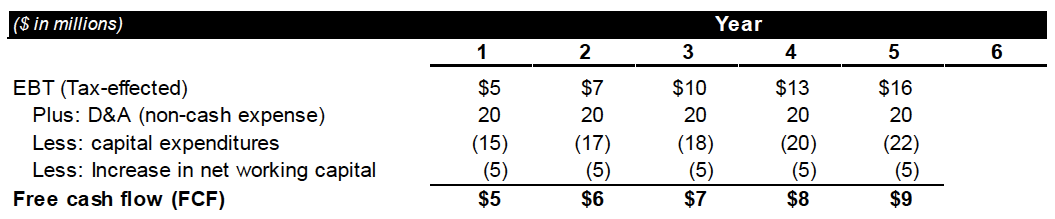
- Start with EBT (Tax-effected) and then add back non-cash expenses (D&A).
$5 million Year 1 tax-effected EBT + $20 million D&A. - Subtract capital expenditures (Capex).
(NOTE: We do not need Year 6 capital expenditures, or Free Cash Flow for that matter, because EBITDA does not incorporate capex and because only FCF in Years 1-5 can be used to pay down debt.)
$100 million Year 1 sales × 15% capex/sales = $15 million Year 1 capital expenditures.
$110 million Year 2 sales × 15% capex/sales = $17 million Year 2 capital expenditures.
$121 million Year 3 sales × 15% capex/sales = $18 million Year 3 capital expenditures.
$133 million Year 4 sales × 15% capex/sales = $20 million Year 4 capital expenditures.
$146 million Year 5 sales × 15% capex/sales = $22 million Year 5 capital expenditures. - Subtract the annual increase in operating working capital to get to Free Cash Flow (FCF).
$5mm Y1 t/a EBT + $20mm D&A – $15mm Y1 capex – $5mm NWC = $5mm Year 1 FCF.
$7mm Y1 t/a EBT + $20mm D&A – $17mm Y2 capex – $5mm NWC = $6mm Year 2 FCF.
$10mm Y1 t/a EBT + $20mm D&A – $18mm Y3 capex – $5mm NWC = $7mm Year 3 FCF.
$13mm Y1 t/a EBT + $20mm D&A – $20mm Y4 capex – $5mm NWC = $8mm Year 4 FCF.
$16mm Y1 t/a EBT + $20mm D&A – $22mm Y5 capex – $5mm NWC = $9mm Year 5 FCF. - Calculate Cumulative Free Cash Flow during the life of the LBO.
Cumulative FCF until exit equals total debt pay-down, if it is assumed that 100% of FCF is used to pay down debt. (This is a standard assumption for a basic LBO model.)
$5 mm Year 1 FCF + $5 mm Year 2 FCF + $7 mm Year 3 FCF + $8 mm Year 4 FCF +
$9 mm Year 5 FCF = $34 mm Cumulative FCF.
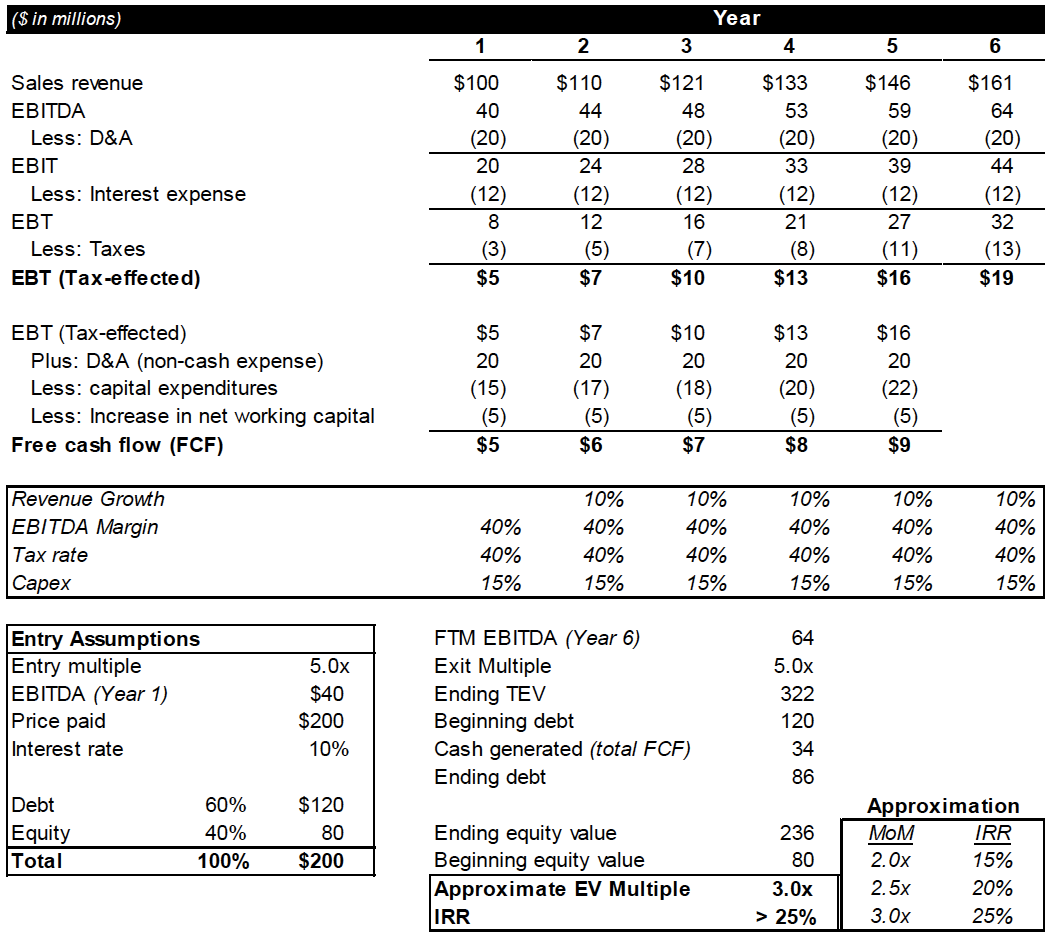
5. Calculate Ending Purchase Price (Exit Value) and Returns
- Calculate Total Enterprise Value (TEV) at Exit.
Take Forward EBITDA at exit (Year 6 EBITDA) along with a 5.0x exit multiple to calculate Exit TEV. $64 million Year 6 EBITDA × 5.0x multiple = $320 million Enterprise Value at Exit. - Calculate Net Debt at Exit (also known as Ending Debt).
Beginning Debt – Debt Pay-down = Ending Debt.
$120 million in Beginning Debt – $34 million in Cumulative FCF = $86 million in Ending Debt. - Calculate ending Equity Value (EV) by subtracting Ending Debt from Exit TEV.
$320 Exit TEV – $86 million Ending Debt = $234 million Ending EV. - Calculate the Multiple-of-Money (MoM) EV return (Ending EV ÷ Beginning EV).
$234 million Ending EV ÷ $80 Beginning EV = 2.93x MoM. - Estimate IRR based on the MoM multiple.
The following table is useful for estimating IRR based upon 5-year MoM multiples:
2.0x MoM over 5 years ~15% IRR
2.5x MoM over 5 years ~20% IRR
3.0x MoM over 5 years ~25% IRR
3.7x MoM over 5 years ~30% IRR
Therefore, we can assume that the implied IRR for the paper LBO case study is approximately 25%, or slightly below. (It is actually very close to 24%.)
The following is the full paper LBO case study exhibit, calculated using Excel rather than pen and paper. As a result, some of the numbers might be slightly different, as rounding has been eliminated:
Final Steps
Make sure to take your time and calculate every formula correctly since this is not a race, and any error that you make will flow through the model you’re building. If you catch a mistake part-way through, you will have to go back and correct it—sometimes causing you to have to recalculate nearly everything, and possibly leading to compounding mistakes on top of the original one.
In addition, the interviewer will ask you to walk through your thought process and calculations. Thus it is important to be able to build the proper paper LBO in simple, accurate steps, and make sure you can walk through the reasoning regarding the process and each calculation. This takes practice, so be sure to practice at least one more paper LBO before your next private equity interview.
Good luck on the case!