Now that you understand what characteristics make up attractive long and short ideas, it is time to explain how to formulate an investment thesis. Being able to construct a real and actionable investment idea is in the heart and soul of an analyst’s work in the hedge fund industry. Building a successful thesis begins with (1) rigorous due diligence at the Micro level, (2) aligning that view with the Macro environment, and (3) understanding the overall trade setup.

Micro
Good Company Qualities
- High return on capital
- Barriers to entry
- Growing industry
- High margins relative to competition
Good Management
- High insider ownership
- Well respected
- Clean accounting
- Infrequent restating of earnings
- Not overly promotional
- Good allocators of capital
All of these qualities are obvious and won’t differentiate your pitch, but they are qualities you will have to talk about, so make sure you understand them well.
Target Price = Your Earnings Estimate × Multiple
Company Earnings
- Will the company beat earnings expectiations in the next quarter or in the next year?
- If so, what are the catalysts that will cause the Company to beat earnings (e.g., higher revenue, higher margins, lower interest expense, share buybacks, etc.)? Paint the picture of how, when, and why there will be a catalyst that supports your view. Providing an opinion without fully understanding and explaining the relevant value drivers will be a recipe for failure.
- What’s your confidence the company will beat earnings? What’s the probability?
- What’s your margin of safety? What can go wrong?
Multiple
- Does your pitch rely on multiple expansion? Why? Where is the company trading relative to its historical multiple? Should the multiple trade at a premium or discount given how the company has changed over the years, and where we are now in the business cycle?
- Where is the company trading relative to its peer group? If the entire market has seen multiple expansion, then is it fair that this company should too? In other words, is it expensive or cheap relative to itself historically and/or its peers, and can you explain why this might be wrong?
- What catalyst is going to cause this multiple to start expanding? Again, paint the picture of how, when, and why there will be a catalyst that supports your view.
- What is your confidence in multiple expansion? What’s the probability?
- What’s your margin of safety? What can go wrong?
Target Price:
Your target price is the product of a forecasted earnings metric multiplied by the expected multiple. This multiple can be P/E, EV/EBITDA, EV/Sales, FCF/Market Cap, or any other reasonable metric. Some metrics are industry-specific and more valuable for those industries than the aforementioned general ones.
Regardless, if you provide a target price, you need to explain how you arrived at this target, and the stages of your thought process to get there. for example, if you claim that a stock is going to have +50% upside, but feel they won’t beat consensus earnings, then you are calling for +50% multiple expansion, pure and simple.
Macro
Although not ideal, stocks in industries with bleak macroeconomic outlooks can still be good investments. It is important to understand what is taking place at the company level, sub-sector level, industry level, and national level. This approach will help you determine whether you are investing in a “good house in a bad neighborhood.”
| Company level: | This is analysis described above (at the micro level). |
| Subsector level: | What is going on with the immediate competitors? Are they growing or taking share? Who are the winners? Who are the losers? Is the overall pie growing? Are there imminent substitute products or competitive products? |
| Sector level: | What are current trends in the industry? For example. are industrials as a whole doing well because of a restocking that is occurring regionally or countrywide? |
| National level: | What is going on nationally? For example, how are rising interest rates going to affect banks and real estate investments? |
Setup
- How has the stock performed heading into the catalyst, i.e, before you put the trade on? If it has already gone up 10% recently, for instance, it will be much harder to outperform on the catalyst.
- How crowded is the trade? Are a lot of hedge funds already invested in the name? One easy way to determine this is to speak to a sell-side research analyst and ask whether they are getting a lot of calls from other funds regarding the company.
- Is the general public bullish or bearish? If you are researching a short pitch, it is key to check for existing short interest (SI function on Bloomberg). If it is a long, you should review the list of major holders of the stock (HDS function on Bloomberg). If the top holders are several hedge funds, then the stock pitch is likely overcrowded and may not be actionable. One of the biggest mistakes in a hedge fund interview is to pitch a stock that every hedge fund has already heard of and evaluated.
Crowded names can still work, but investors must tread lightly. When the market sells off or there is a change in sentiment, crowded names typically perform the worst. To check this, there is an index on Bloomberg of high hedge fund ownership stocks; you can use it to see whether your idea is on that list to make sure it isn’t already an overcrowded trade idea.
Other technical tools that can help evaluate the setup for a stock include RSI (relative strength index) and moving averages. The RSI is a momentum indicator—below 30 is considered oversold and above 70 is considered overbought.
Ideally, you want a stock that has recently underperformed its peers, is lightly owned by hedge funds, and is heading into a catalyst that you think will have a positive surprise. By contrast, a crowded name that has already outperformed based on the expectation of a positive catalyst will likely get a limited reaction if and when the catalyst does occur. For example, it is very common for companies to beat earnings expectations but not to experience an increase in their stock prices, because the general public or hedge funds are already expecting the earnings surprise. In today’s hyper-competitive market, one needs a truly different variant perception in order to outperform the market.
Other Investing Thoughts
- What constitutes a good investment idea? What does that phrase even mean? The answer is that it means something different to every person–that is what provides opportunities in a market. That is why some investors own a stock and others short it. If everyone agreed on what makes a good investment then everyone would own the same stocks.
- How much should you make per idea? Investors do not even agree on this principle. Developing frameworks for investing will help you follow a set of guidelines that you can refine over the years through experience, and as part of that, you will learn to determine what the expected profit and acceptable risk for a particular investment are.
Value Investing Framework
- Benjamin Graham defined the first basic tenant of value investing as follows: when the price of a security diverges from its intrinsic value (its corresponding cash flows), a value investor should work to exploit that divergence.
- The second basic tenant of value investing is the margin of safety: a security should preferably be purchased at a deep discount to its intrinsic value, to help limit the amount of downside risk the investment has.
Street of Walls Investing Framework
- It is very easy to get ideas from other investment professionals, but it will be very obvious in your pitch whether you have done the analytic work yourself or not.
- This is typically discovered when you are questioned on your assumptions in the model. If you built the model yourself, you can likely defend the assumptions much more intelligently.
Industry Analysis
Market Size and Growth
Study the market size and growth of the company’s core industry. Even though you may be studying the beverage industry, the manufacturing companies and distribution companies have very different dynamics. The beverage manufacturers may not be growing much faster than CPI, but the distributors may be going through a massive consolidation period and therefore have earnings that are growing at a much faster pace.
Historical Industry Returns
A security may be cheap and look attractive, but that may be because the returns of the company and the industry are not attractive. For example, the stock Owens Corning (OC) traded at 8x earnings for a long time. This sounds inexpensive, but it was ultimately justified because operating margins were in the single digits. Eventually, however, industry did consolidate and operating margins expanded to 20%. Thereafter, the company’s earnings multiple expanded into the low teens.
Unit Economics
Most bottom-up, fundamental analysis is used to study the unit economics of a company. For example, what does it cost to make and sell one unit of output, and what is the profit on that unit? What are the pricing and volume trends? It is important to understand the value drivers clearly in order to build a detailed operating model for your pitch.
Competitive Positioning
- Do certain companies control industry pricing?
- How sustainable is the company’s competitive advantage?
- Are there high or low switching costs?
- Does branding matter
- Are there regulatory protections, such as tariffs?
- What important considerations are there with respect to the company’s customers and suppliers?
Cyclical / Seasonal
An industry may be in a strong growth period and look very attractive, but it may also be at the peak of a cycle that is possibly about to turn substantially negative. For example, the housing industry looked extremely attractive in the early 2000s, but crashed and was extremely unattractive into the late 2000s and beyond. This is due to both an economic downturn and a systematic overbuilding of homes that collapsed in the middle of the decade. In addition to the economic/business cycle, certain industries have drivers of cyclicality that are very specific. One example of this is the Oil & Gas industry—the price of oil alone can have a huge impact on a Oil & Gas company’s earnings potential.
It is also important to understand the seasonality of the business. Retailers tend to sell more product during the fourth quarter of the year, because of the holiday shopping season. Therefore, it may be wrong to extrapolate a trend in March and April if the majority of the company’s sales take place in the later months.
Investment Considerations
Management
When you start working for a hedge fund you will quickly learn that each fund has their own unique investment style. Some hedge funds simply will not invest in companies that have weak management teams. It does not matter how attractive the opportunity or valuation is—the fund simply won’t invest. This principle often results from an investor getting burned from a bad management decision, such as a bad acquisition, or a focus on short-term earnings at the expense of long-term objectives. After gaining experience analyzing companies, you will eventually develop your own philosophy. Still, bear in mind that other investors may have an opinion on this topic that differs from yours, and you need to consider the philosophies of your teammates when evaluating an investment idea.
In studying management teams, you should look at the management team’s track record and understand both the buy-side and sell-side opinion on the management team. Study the company’s internal philosophy: how do they allocate capital? Is the current management team following what the company has always done? Another key to understanding how a management team will probably act is to study how the members are compensated. Is their compensation tied to revenue or earnings, return on capital, or some other metric? How much stock does the management team currently own? How much risk are they taking? Are they buying or selling stock? How many options do they have outstanding?
Valuation
Study both relative and absolute valuation. A stock may appear cheap when compared to a stock in another sector, but very expensive against its peers. Thus, different investment situations call for different valuation metrics to be used.
One example of this principle is that it is completely unhelpful to use P/E if the company has no earnings (or negative earnings). You should also study the rate of growth of the earnings metric you chose. A company may look expensive at 30x earnings, but if it is doubling revenue every year and tripling earnings, it may not be so expensive after all. In fact, if you believe that this trend can continue, it may be an excellent long investment idea.
- Is there a difference between your earnings estimates and those of the street?
- If not, is your thesis really interesting, or is it just a “consensus trade”?
- What are the key events that the street will care about? Is it an earnings release, a new product release, or something more unusual?
- Does the street care about what happens next quarter or are they more focused on the potential signing of a big contract that could take place at any time?
Risks
Donald Rumsfeld once said there are “Known unknowns and unknown unknowns.” Some risks are riskier than others. How does the company control for this? How do you as the investor assess the downside risk from this?
- What has to happen for the downside case to play out?
- What has to happen in order to lose some benchmark amount, say 20% or more?
- If that event plays out, what will happen to the multiple? Will it go down or actually expand?
- All in all, what is the probability of a downside event and what is the maximum potential loss you might face in such a scenario?
Catalysts
Catalysts are extremely important in identifying when you are going to “get paid.” This is a crucial factor in sizing positions. If a catalyst is expected to take place in the near future, you probably want to have your position fully sized immediately. If not, it may make sense to taper into a position.
Framework for Investing: Large Market Movements
Rising Markets: The typical reaction to a rising stock price is to “chase” the returns. That means when a stock continuously goes up, day after day, the investor feels like he or she is missing an opportunity, and will be inclined to buy the stock. This pile-on mentality causes more investors to become a part of the action. This is a classic, human reaction to a strongly outperforming stock, and it can often lead to poor returns due to an undisciplined approach and the fickle nature of the market.
The same thing can happen when a stock continues to drop in price. Investors tend to panic and sell at exactly the worst time. During the heat of the battle, people tend to get emotional and sell their best stocks out of fear.
What to Do
- Tell yourself it is normal to react this way when you are losing a lot of money. Fear is normal: both the fear of missing an opportunity and the fear of continuing to lose more money.
- Ask yourself, “Has my investment thesis changed?” If it has, then sell, but if it has not, then ignore your fears and hold the position.
- Have strict target prices in place. This will help you exit a position once your target has been achieved, and thereby avoid the trap of trying to “ride a winner.”
Here is a related excerpt written by Benjamin Graham, from The Intelligent Investor:
- “Imagine that in some private business you own a small share that costs you $1,000. One of your partners, named Mr. Market, is very obliging indeed. Every day he tells you what he thinks your interest is worth and furthermore offers either to buy you out or to sell you an additional interest on that basis. Sometimes his idea of value appears plausible and justified by business developments and prospects, as you know them. Often, on the other hand, the value he proposes seems to you a little short of silly.
- If you are a prudent investor or a sensible businessman, will you let Mr. Market’s daily communication determine your view of the value of $1,000 interest in the enterprise? Only in case you agree with him, or in case you want to trade with him. You may be happy to sell out to him when he quotes you a ridiculously high price, and equally happy to buy from him when his price is low. But the rest of the time you will be wiser to form your own ideas of the value of your holdings, based on full reports from the company about its operations and financial position.”
Trading Considerations
Liquidity
The liquidity of a single stock is not a reason for a fundamental investor to buy a stock, but it can definitely be a reason for an investor not to buy a stock. The less liquid a stock is, the riskier the position becomes, as it is difficult to exit an illiquid position—especially during turbulent market conditions, when liquidity is often demanded.
In order to determine how liquid a stock is, you need to see how many shares trade on a regular basis. For example, if the average daily volume of a $10 stock is 1 million shares, then the stock trades $10 million per day. If you have a $1 million hedge fund, and you want to take a 10% position, you will need to buy $100,000 worth of stock, or 10,000 shares. If you wanted to buy all of that stock in 1 day you could, as you would only account for 1% of the daily volume ($100,000 in stock to be purchased ÷ $10,000,000 daily volume = 1%). A reasonable rule of thumb is that you do not want to account for more than 10-15% of a stock’s daily trading volume if you do not want to influence its price. So in this example, you could buy up to $1,500,000 worth of stock per day without moving the share price. If you were to buy $2,000,000 of stock in 1 day, or 20% of the daily volume, you would likely cause the stock price to increase (at least temporarily). If your desired position is much larger, then it could take many days to accumulate the desired position – and similarly, it could take a long time to unwind the position when you want to exit. This makes the investment much more risky.
Therefore, a stock may have fantastic management, excellent earnings growth, and an attractive price, but if there is no liquidity you probably simply cannot buy it.
Shareholder Base
You may think that you have found a gem: a rare and precious investment opportunity that no other hedge fund is talking about. Fortunately, that notion is relatively easy to confirm or disprove. To check and see whether other sophisticated investors are involved in the company you’re researching, you can pull up the company’s quarterly holdings report on Bloomberg and see who the largest shareholders are.
For example, suppose that W.R. Grace (GRA) offers an exciting investment opportunity, according to your analysis. However, looking at the holders list, you determine that other hedge funds are well aware of this opportunity, as the top shareholders include large hedge funds such as Lone Pine, York Capital, TPG Axon, and Hound Partners.
It may not be a bad thing that other hedge funds are involved. You will probably be invested in a good company in this case, as large hedge funds rarely get involved in unsound investment ideas. That being said, crowded trades can, again, be very risky. First, if the market is already anticipating good news, it may be that the good news is already baked into the stock price. Second, if bad news comes out, then everyone will likely be forced to run for the exits at the same time. This will lead to adverse price movement that could destroy your holding.
Hedge funds in general tend to be short-term focused, so it could turn into a situation where one investor exits swiftly and triggers a domino-effect panic, crushing other investors in the wake.

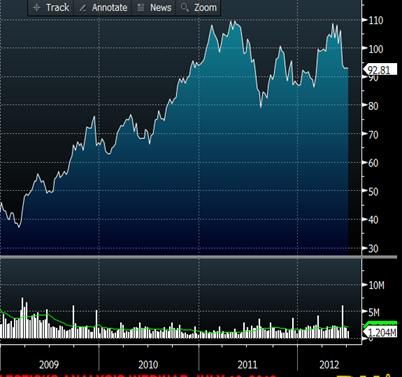
Charting
Looking at charts can be very deceiving and can create misleading signals. For example, the stock chart below shows a quickly rising stock price, but that does not mean it is expensive. It may be cheap relative to its own history, the rest of the sector, or the market as a whole. The entire stock market might have been going up rapidly, or the sector as a whole might have had a big rally, and relative to the sector the stock underperformed, so it may actually be cheap on a relative basis.
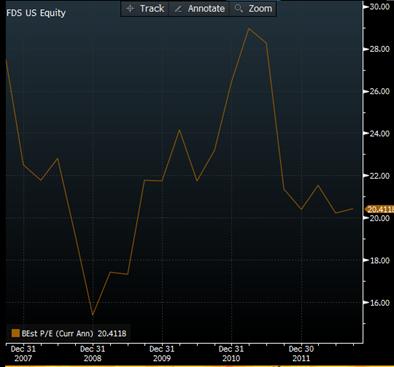
You may also want to compare several valuation metrics simultaneously. For example, a company may look expensive on a Price/Earnings basis but cheap on an EV/EBITDA basis.
In the graph below, you can see that Factset Research Systems (FDS) is trading at 20x P/E. Relative to the market that is high, but relative to its own history, that is a normal trading ratio.
Business Model Questions
It is just as important to understand the industry in which a company operates as it is to understand the company itself. For example, if you are studying a homebuilder, it is important to understand the companies the homebuilders buy supplies from. If the building products companies are raising their prices and the homebuilder cannot raise prices, the builders are going to see their margins compress. Therefore, it is important to scan what is happening with related companies across the industry and sector to get a sense of the overall dynamic affecting the company’s earnings potential.
Homebuilding Industry: Related Participants
- Building Materials – USG, EXP, VMC, SHW
- Home Builders – LEN, DHI, KBH
- Building Products – WHR, MAS
- Furniture – TPX, LZB, ETH
- Extensions – Lawn care – SMG
- Mortgage Originator – BAC, C
- Insurance Provider – PRU, MET
A change by the mortgage originator will likely have an impact on the entire industry. If Bank of America (BAC) tightens its origination standards, then people will buy fewer homes; homebuilders will buy less carpet to go inside the homes; fewer beds will be sold; etc. Therefore, before considering an investment in a homebuilder or related entity, it would behoove you to perform checks to see what else is occurring in related industries and sectors across the value chain.
Business Model Advantages
Barriers to Entry
Companies with barriers to entry have a huge advantage relative to companies that do not. These barriers can occur for a variety of reasons, but some of the most common include economies of scale, substantial investment requirements, technological innovation, favorable government regulation, and networking effects. eBay, for example, is an extremely difficult company to compete against, because the company has established a formidable position as the largest Internet-based auction site available. Both buyers and sellers are unlikely to go to other sites, because both realize that eBay offers more individuals on the other side of the aisle to transact with. This makes it hard for new auction companies to compete with eBay effectively.
Companies in most industries will claim that they have high barriers to entry, but time will often show that a company earning significantly higher than its cost of capital will attract competitors. Put simply, if the company is earning outsized returns on the capital it invests, then it will attract competitor investment seeking to earn comparable returns. This competitive investment will result in increased production and sales competition, and diminished profit-earning potential will surely follow in the future.
Cost Advantages
The low-cost producer can have a huge advantage over its competition. In industries with large legacy assets, such as cement or coal production, the players with the newest assets are typically the lowest cost providers, and that allows for lower pricing often results in greater market share.
Alternatively, there is also a learning curve that can create the reverse effect, wherein the older industry participants have lower costs as the newer players are still “figuring it out.”
Customer Habits
Repeat purchase items, such as paper or office supplies, can create a strong advantage for the producer. The more entrenched companies become within their customer bases, the higher the switching costs for those customers. For example, a large technology roll-out may effectively lock a customer in to the provider’s products, as it costs too much to execute a complete technology overhaul to switch to a different vendor.
Economies of Scale
Companies with large fixed costs need scale in order to make a profit. The larger the fixed costs, the larger the scale needs to be. Incremental margins can be very high once a company crosses a certain threshold and is able to sufficiently leverage its cost base. This can make a company highly attractive and cause a company to trade at a high multiple, once the threshold production level has been achieved. This phenomenon is sometimes referred to as “operating leverage.”
Oligopolies, or Monopolistic Competition
Functioning oligopolies can act similar to monopolies, in terms of locking in outsized profit margins from its business. These situations should not take place for long according to basic economic theory, but they can and quite often do. For example, the roofing industry has greatly consolidated in recent years, so that four players currently control 80% of the roofing shingle manufacturing market. When one of the four manufacturers raises its prices, the other three can easily follow. For the past five years, none of the players has broken from the pack and tried to steal market share from the other three by offering a lower price. As a result, the industry has seen its operating margins grow from 8% to 20% in recent years. Whether this increase in margin is sustainable over the long term remains to be seen.
Expected Return
What is a “good” return for a portfolio? How do you know? What is a good return for an individual investment?
The Academic Approach
Expected Rate of Return = Risk-free return + Beta × (Expected Market Return – Risk-free return)
This is the equation from the Capital Asset Pricing Model (CAPM), which you will learn in school—but try pitching this to a portfolio manager at a hedge fund. He or she will likely tell you to get lost!
Theoretically this makes perfect sense, but most hedge funds don’t use this as a hurdle rate. Most funds target a 20% return—though very few are capable of actually achieving that return consistently.
The Practical Hedge Fund Approach
A more practical approach is to study what percentage of the time you will make money and lose money on your investments. From there, you need to understand how much you make when you are right and how much you lose when you are wrong. Here is an example of this framework:
As you can see:
Average Return per Idea = (% Right × Avg. Return When Right) + (% Wrong × Avg. Loss When Wrong)
% Right is often referred to as your “Hit Rate,” and Average Return When Right is often referred to as your “Slugging Rate.” The magnitude of your wins relative to that of your losses is referred to as your “Win/Loss Ratio.”
The best analysts are right about 60% of the time. Most people think they will be right closer to 75%, but the sad truth is that most investors will not do much better than 50%. You can still make money being right only 50% of the time, but you have to be very disciplined about cutting your losses. That is why maintaining a 2-to-1 Win/Loss ratio is so important.
Here is what is so troubling about the example given above: a fantastic analyst who is right 60% of the time, makes a 30% return when right, and maintains a 2-to-1 Win/Loss ratio, will only earn an average return of 12% per idea. However, as we noted, most hedge funds try to earn 20%, so how can they do this?
One possible solution is to employ leverage, but from an analyst’s perspective, he/she typically does not have control over this. So how can an analyst generate a higher return per idea?
A higher Hit Rate is very difficult to achieve. Also, achieving greater than a 2-to-1 Win/Loss ratio is also not realistic, as it would require tighter stop-loss controls that may result in the premature exit of lucrative investments simply because they took an initial “hit” before panning out.
Therefore the only real area to control is the Slugging Rate. If this is the lever, then the analyst cannot afford to invest in stocks that will only earn 10%, 20%, or even 30%. It is just not a high enough annualized return. At a 40% Slugging Rate, the analyst can get closer to the elusive 20% total return hurdle.
40% thus tends to be a “sweet spot” for many hedge fund analysts, as a minimum hurdle rate of return for putting on a position. If the investment only has a 6-month duration, then the return only needs to be 20%, which is roughly 40% on an annualized basis.
Searching for 40% Returns
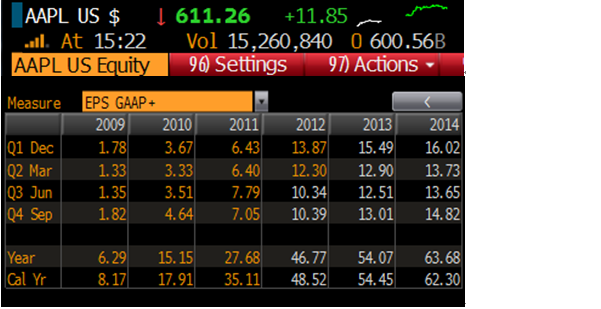
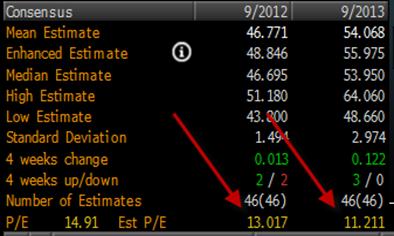
What needs to happen in order for a stock price to increase? Either earnings need to expand, or the multiple needs to expand, or a combination of the two. The first step is to look at where the sell-side estimates are for the current year and two years into the future. If AAPL is trading at $611 today and is expected to earn $54 in 2013 and $63 in 2014, it is trading at 11x P/E and 10x P/E in 2013 and 2014. In order for the stock to reach $855, or 40% higher, you might project earnings to be 20% higher than the street in 2013 at ~$65, and for the multiple to expand by 20% to ~13x. Or, you might predict stronger earnings growth and less multiple expansion, or vice versa.
As you can see, it pays to think through different scenarios needed to achieve your target return.
A common mistake analysts make is to say that they believe a stock will appreciate by an amount but have earnings expectations that equal or are very similar to those of sell-side earnings estimates. That means that for the investment thesis to prove correct, the stock must increase entirely due to multiple expansion. That is generally viewed as a “low-quality” thesis, as expansion in a valuation multiple is more difficult to predict and gain confidence in than is growth in earnings.